Объяснение фронтенда
В этой главе мы рассмотрим основы пользовательского интерфейса Zabbix и то, что нам нужно знать, прежде чем мы начнем полностью погружаться в наш инструмент мониторинга. Мы увидим, как работает пользовательский интерфейс, как добавить узел, группы пользователей, элементы... чтобы у нас было хорошее понимание основ. Это то, что иногда упускается из виду и может привести к разочарованию, когда мы не знаем, почему все работает не так, как мы ожидали. Поэтому даже если вы опытный пользователь, то Вам будет полезно заглянуть в эту главу.
Давайте начнем
Обзор интерфейса
В Zabbix 7 пользовательский интерфейс после входа в систему немного изменился. Наше меню в левой части экрана подверглось небольшой перестройке. Давайте погрузимся в него. Когда мы в первый раз входим в систему Zabbix под пользователем Admin, мы видим страницу
например, вот так: наше главное окно отмечено
зеленым, наше главное меню отмечено
красным, а наши ссылки отмечены
желтым.
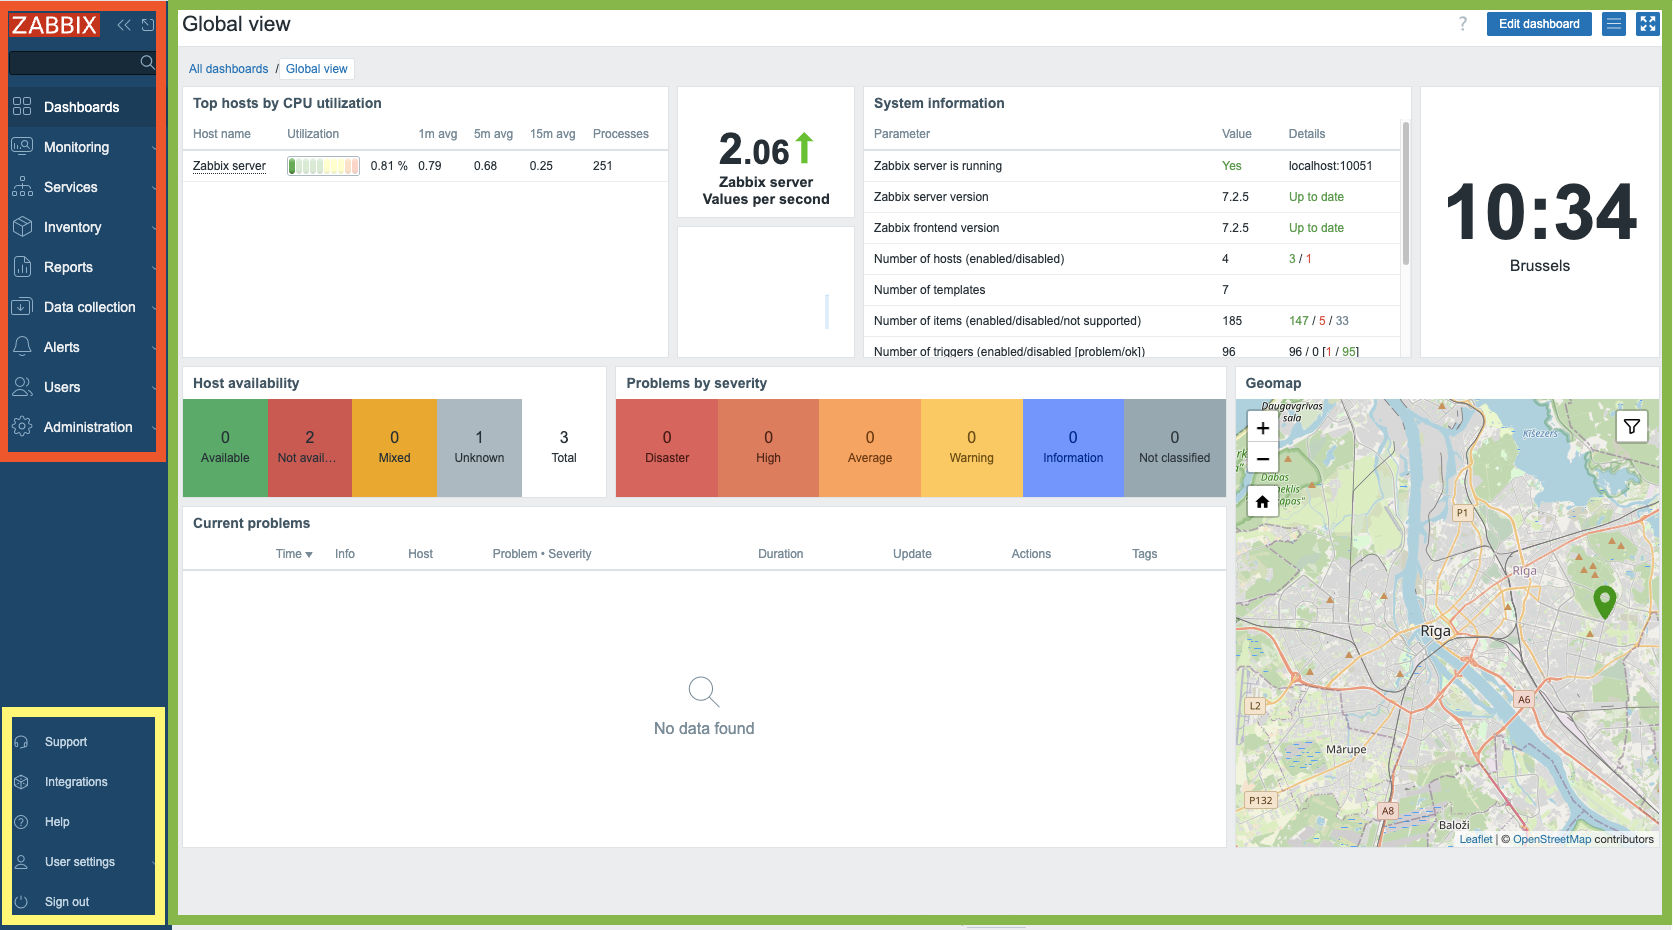
2.1 Обзор
Главное меню можно скрыть, свернув его полностью или сведя к набору маленьких иконок. Когда мы нажимаем на кнопку с двумя стрелками слева:

2.2 Свернуть
Вы увидите, что меню сворачивается до набора маленьких иконок. Нажав ">>", вы
вернете главное меню в исходное состояние.
При нажатии на иконку, похожую на квадратик с торчащей стрелкой, рядом с кнопкой
"<<" главное меню будет полностью скрыто.

2.3 Скрыть
Вернуть наше главное меню довольно просто: ищем кнопку слева с тремя
горизонтальными линиями и нажимаем на нее. В результате появится главное меню
, но оно не останется. Если мы нажмем на поле со стрелкой, направленной в правый
нижний угол, это вернет главное меню на прежнее место.
Еще один способ сделать экран больше, который весьма полезен, например, для
мониторов в командах NOK - это кнопка Режим киоска. Эта кнопка расположена в
левой части экрана и выглядит как 4 стрелки, направленные в каждый угол экрана.
Нажатие этой кнопки убирает все меню и оставляет только главное окно , на
котором можно сосредоточиться.

2.4 Развернуть
Когда мы захотим выйти из режима киоска, кнопка сменится на 2 стрелки, направленные внутрь экрана. Нажатие на эту кнопку вернет нас в исходное состояние.

2.5 Свернуть
Tip
We can also enter and exit kiosk mode by making use of parameters in our Zabbix
url: /zabbix.php?action=dashboard.view&kiosk=1 - activate kiosk mode or
/zabbix.php?action=dashboard.view&kiosk=0 - activate normal mode.
Note
There are many other page parameters we can use. A full list can be found at https://www.zabbix.com/documentation/7.4/en/manual/web_interface/page_parameters Zabbix also has a global search menu that we can use to find hosts, host groups and templates.
Если мы введем в поле поиска слово сервер, то получим обзор всех шаблонов ,
групп узлов и узлы с указанным именем сервера. Поэтому это поле называется
глобальным поиском.
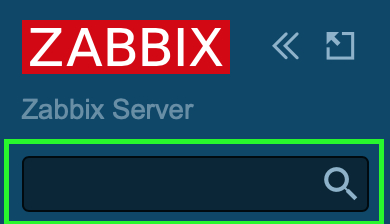
2.6 Глобальный поиск
Это наш результат после поиска слова сервер. Если у вас стандартная настройка
Zabbix, то ваша страница должна выглядеть примерно так же.
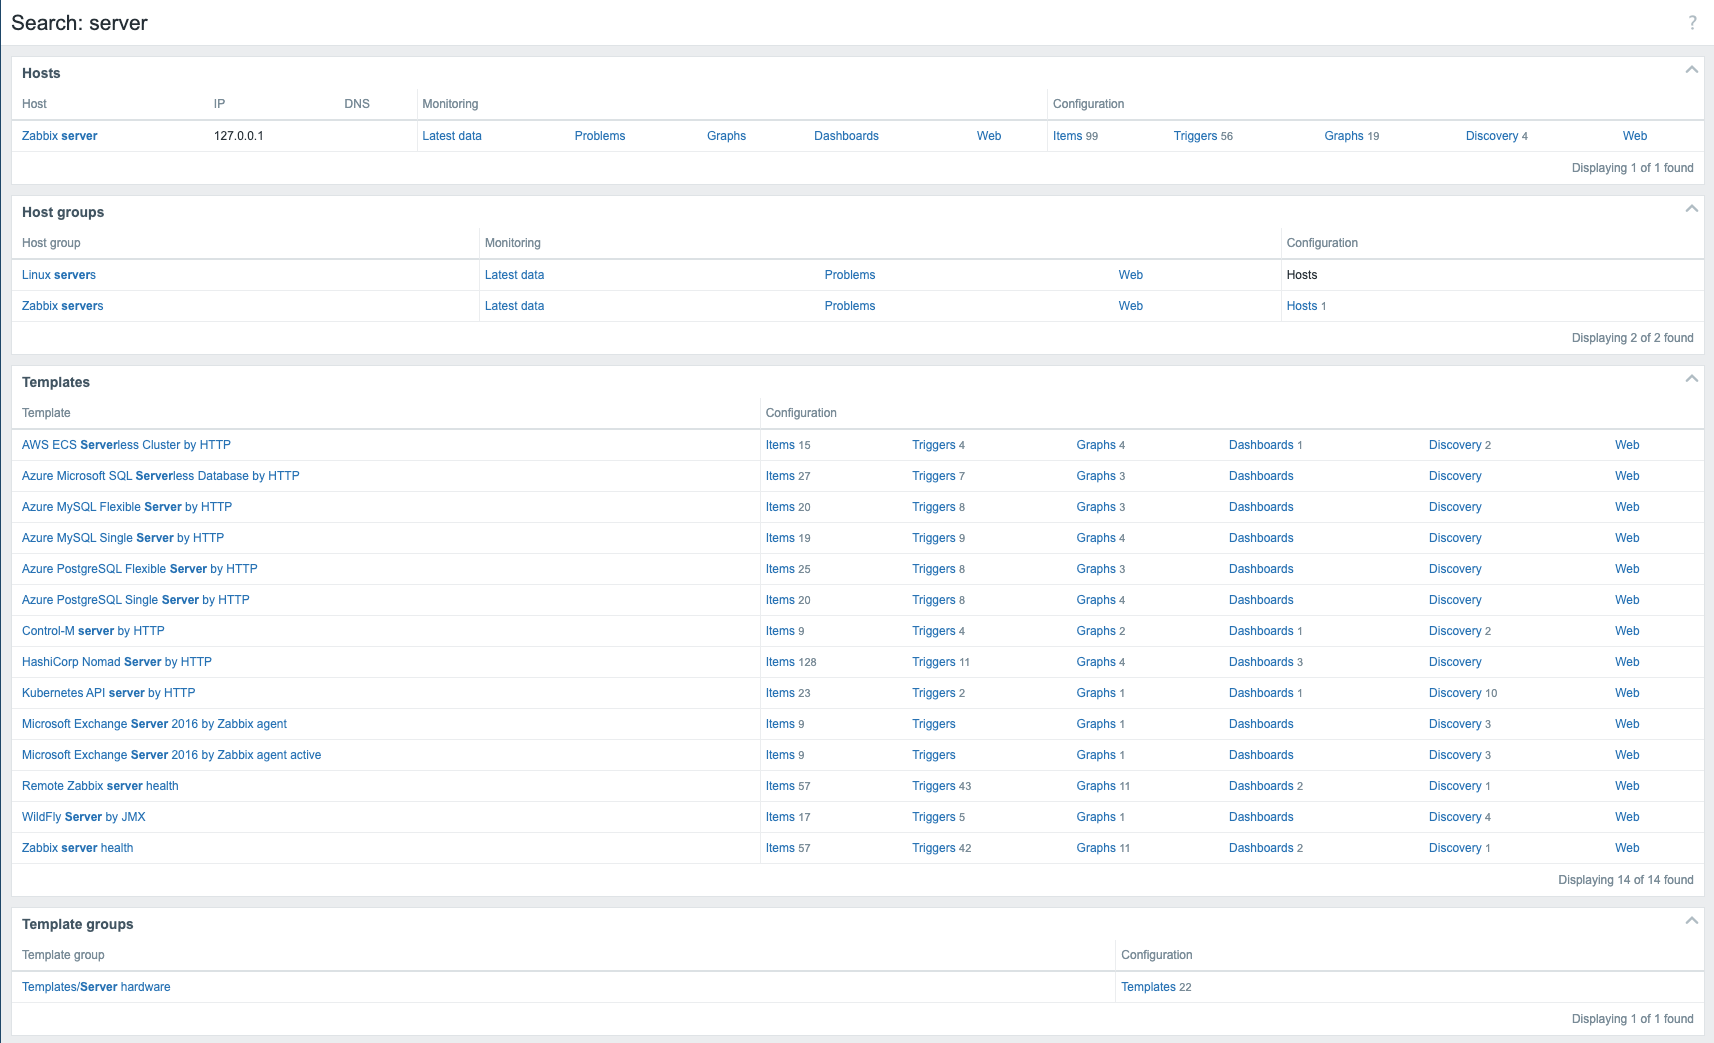
2.7 Результаты глобального поиска
Главное меню
Теперь мы кратко рассмотрим составные части основного меню приложения. Главное
меню, расположенное в левой части интерфейса, состоит из девяти отдельных
разделов:
| Название меню | Подробности |
|---|---|
| Панели | Содержит обзор всех панелей, к которым мы имеем доступ. |
| Мониторинг | Показывает нам узлы, проблемы, последние данные, карты, ... |
| Службы | Обзор всех служб и настроек SLA. |
| Инвентаризация | Обзор собранных нами данных инвентаризации. |
| Отчеты | Показывает нам системную информацию, запланированные отчеты, журналы аудита, журналы действий и т.д. |
| Сбор данных | Содержит все вещи, связанные со сбором данных, такие как узлы, шаблоны, обслуживание, обнаружение, ... |
| Оповещения | Конфигурация наших типов медиаданных, скриптов и действий |
| Пользователи | Настройка пользователей, например, роли пользователей, группы пользователей, аутентификация, API-токены, ... |
| Администрирование | Часть администрирования, содержащая все глобальные настройки, диспетчер, прокси, очередь, ... |
Меню ссылок
Непосредственно рядом с основным меню приложения в левой части интерфейса
расположено меню Ссылок. Этот модуль содержит коллекцию гиперссылок для
доступа пользователей.
| Название меню | Подробности |
|---|---|
| Поддержка | This brings us to the technical support page that you can buy from Zabbix. Remember that your local partner is also able to sell these contracts and can help you in your own language. Your local distributors |
| Интеграции | The official zabbix integration page |
| Справка | Ссылка на документацию по вашей версии Zabbix |
| User settings | The user profile settings. |
| Sign out | Log out of the current session. |
A few interactive elements remains to be addressed on the right-hand portion of the display.

2.8 Edit dashboard
The Edit dashboard button facilitates modification of the user's dashboard
configuration, a feature that will be elaborated upon in subsequent sections.
Located on the extreme left margin is a query mark icon ('?'), activation of
which redirects the user to the Zabbix documentation portal providing
comprehensive details regarding dashboard functionalities. Conversely, the
control situated on the right margin, represented by three horizontal lines,
provides access to operations such as sharing, renaming, and deletion of user
defined dashboards.
System information
The dashboard also features a dedicated panel labeled System Information. This
widget provides a real-time overview of the operational status of the Zabbix
deployment. We will now examine the individual data points presented within this
panel, as their interpretation is crucial for system comprehension.
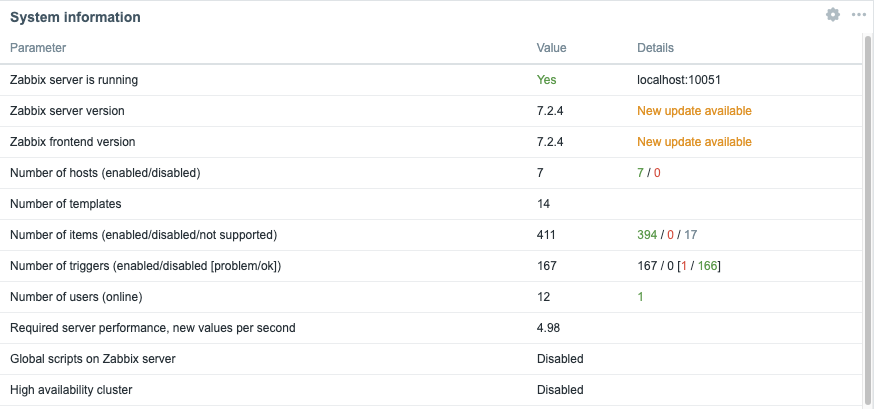
2.9 System Information
| Parameter | Value | Подробности |
|---|---|---|
| Zabbix server is running | The status of our zabbix server if it is running yes or no and if it is running on our localhost or another IP and on what port the zabbix server is listening. If no trapper is listening the rest of the information can not be displayed | IP and port of the Zabbix server |
| Zabbix server version | This shows us the version of the Zabbix server so the version you see at the bottom of your screen is the one from the Zabbix frontend and can be different but should be in the same major version. |
Version Number |
| Zabbix frontend version | Это версия фронтенда, которая должна совпадать с той, что вы видите внизу экрана. | Version Number |
| Количество узлов (включено/выключено) | Общее количество узлов, настроенных в нашей системе | Сколько из них включено и выключено |
| Количество шаблонов | Количество шаблонов, установленных на нашем сервере Zabbix. | |
| Количество элементов (включено/выключено/не поддерживается) | This line shows us the number of items we have configured in total in this case 99 | 90 are enabled and 0 are disabled but 9 of them are unsupported. This last number is important as those are items not working. We will look into this later why it happens and how to fix it. For now remember that a high number of unsupported items is not a good idea. |
| Number of triggers (Enabled/disabled[problem/ok]) | The number of triggers configured | Number of enabled and disabled triggers. Just as with items we also see if there are triggers that are in a problem state or ok state. A trigger in a problem state is a non working trigger something we need to monitor and fix. We will cover this also later. |
| Number of users (online) | Here we see the number of users that are configured on our system | Количество пользователей онлайн в настоящее время. |
| Требуемая производительность сервера, nvps | Количество новых значений в секунду, которые Zabbix будет обрабатывать. | This is just an estimated number as some values we get are unknown so the real value is probably higher. So we can have some indication about how many IOPS we need and how busy our database is. A better indication is probably the internal item zabbix[wcache,values,all] |
| Глобальные скрипты на сервере Zabbix | Он уведомляет нас о том, что глобальные скрипты включены или выключены в конфигурации сервера. | Глобальные скрипты можно использовать во фронтенде, действиях, ... но сначала их нужно активировать |
| Кластер высокой доступности | Он покажет нам, отключен ли кластер Zabbix HA или нет | Задержка обхода отказа после активации HA |
Включение глобального выполнения скриптов
Global script execution on Zabbix server can be enabled by setting
EnableGlobalScripts=1 in the Zabbix server configuration at /etc/zabbix/zabbix_server.d/.
For new installations, since Zabbix 7.0, global script execution is
disabled by default.
Tip
System information may display some additional warnings like:
- when your database doesn't have the correct character set or collation UTF-8.
- when the database you used is lower or higher then the recommended version or
- when there are misconfigurations on housekeeper or TimescaleDB.
Another warning you can see is about database history tables that aren't upgraded or primary keys that have not been set. This is possible if you are coming from an older version before Zabbix 6 and never did the upgrade.
Обзор главного меню
It's important to know that we have seen so far our dashboard with the Admin
user and that this user is a Zabbix Super Admin user. This has a serious
impact on what we can see and do in Zabbix as this user has no restrictions.
Zabbix works with 3 different levels of users we have the regular users,
Zabbix Admin and Zabbix Super Admin users. Let's have a deeper look at the
differences :
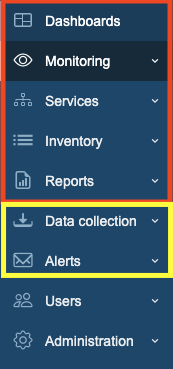
2.10 Main menu sections
- A
Zabbix Userwill only see the red part of ourmain menuand will only be able to see our collected data. - A
Zabbix Adminwill see the red part and the yellow part of themain menuand is able to change our configuration. - A
Zabbix Super Adminwill see the completemain menuand so is able to change the configuration and all the global settings.
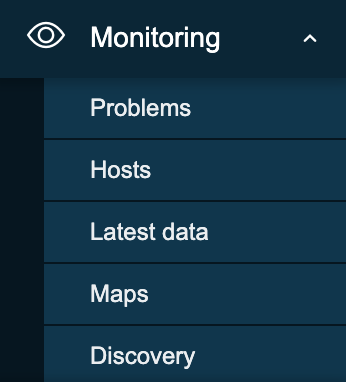
2.11 Monitoring menu
- Problems: This page will give us an overview of all the problems. With filter we can look at recent problems past problems and problems that are active now. There are many more filters tor drill down more.
- Hosts: This will give us a quick overview page with what's happening on our hosts and allows us to quickly go to the latest data, graphs and dashboards.
- Latest data: This page I probably use the most, it shows us all the information collected from all our hosts.
- Maps: The location where we can create map that are an overview of our IT infrastructure very useful to get a high level overview of the network.
- Discovery: When we run a network discovery this is the place where we can find the results.
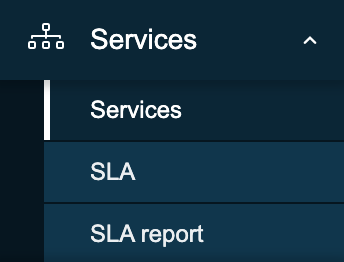
2.12 Services menu
- Services: This page will give us a high level overview of all services configured in Zabbix.
- SLA: An overview of all the SLAs configured in Zabbix.
- SLA Report: Here we can watch all SLA reports based on our filters.
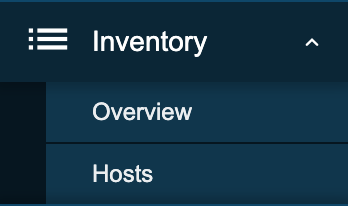
2.13 Inventory menu
- Overview: A place where we can watch all our inventory data that we have retrieved from our hosts.
- Hosts: Here we can filter by host and watch all inventory data for the hosts we have selected.
2.14 Inventory menu
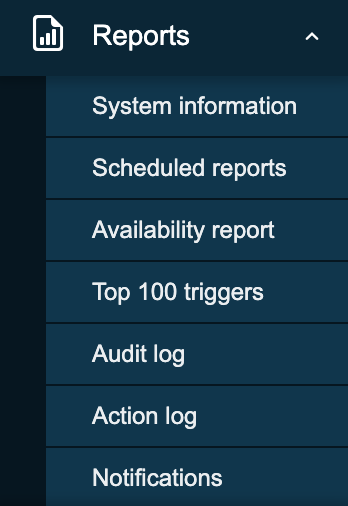
- System information: System information is a summary of key Zabbix server and system data.
- Scheduled reports: The place where we can schedule our reports, a
pdfof the dashboard that will be sent at a specified time and date. - Availability report: A nice overview where we can see what trigger has
been in
ok/nokstate for how much % of the time - Top 100 triggers: Another page I visit a lot here we have our top list
with triggers that have been in a
NOKstate. - Audit log: An overview of the user activity that happened on our system. Useful if we want to know who did what and when.
- Action log: A detailed overview of our actions can be found here. What mail was sent to who and when ...?
- Notifications: A quick overview of the number of notifications sent to each user.
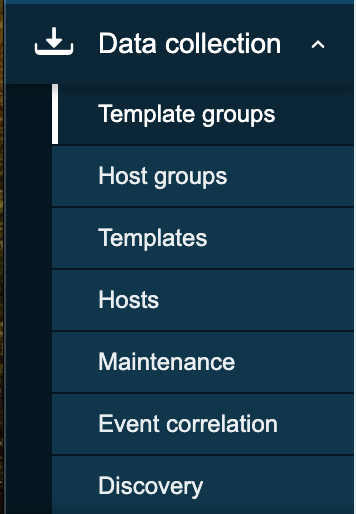
2.15 Data collection
- Template groups: A place to logical group all templates together in different groups. Before it was mixed together with hosts in host groups.
- Host groups: A logical collection of different hosts put together. Host groups are used for our permissions.
- Templates: A set off entities like items and triggers can be grouped together on a template, A template can be applied to one or more hosts.
- Hosts: What we need in Zabbix to monitor A host, application, service ...
- Maintenance: The place to configure our maintenance windows. A maintenance can be planned in this location.
- Event correlation: When we have multiple events that fires triggers related we can configure correlations in this place.
- Discovery: Sometimes we like to use Zabbix to discover devices, services,... on our network. This can be done here.
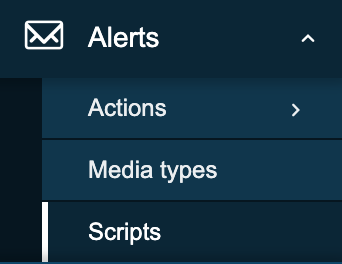
2.16 Alerts menu
- Actions: This menu allows us to configure actions based on
eventsin Zabbix. We can create such actions for triggers, services, discovery, autoregistration and internal events. - Media types: Zabbix can sent messages, emails etc ... based on the actions we have configured. Those media types need templates and need to be activated.
- Scripts: In Zabbix it's possible to make use of scripts in our actions and frontend. Those actions need to be created here first and configured.
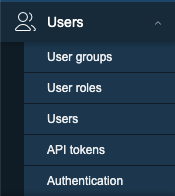
2.17 Users menu
- User groups: The
User groupsmenu section enables the creation and management of user groupings for streamlined access and permission control. - User roles: The
User rolesmenu section defines sets of permissions that can be assigned to individual users, limiting their allowed actions based on the user type they have within the system. - Users: The
Usersmenu section provides the interface for managing individual user accounts, including creation and modification settings. - API tokens: The
API tokensmenu section manages authentication credentials specifically designed for programmatic access to the system's Application Programming Interface (API), enabling secure automation and integration with external applications. - Authentication: The
Authenticationmenu section configures the methods and settings used to verify user identities and control access to the system.
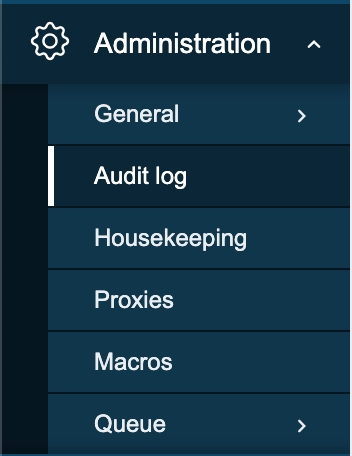
2.18 Administration menu
- General: The
Generalmenu section within administration allows configuration of core system-wide settings and parameters. - Audit log: The
Audit logmenu section provides a chronological record of system activities and user actions for security monitoring and troubleshooting. - Housekeeping: The
Housekeepingmenu section configures automated maintenance tasks for managing historical data and system performance. - Proxies: The
Proxiesmenu section manages the configuration and monitoring of proxy servers used for communication with managed hosts in distributed environments. - Macros: The
Macrosmenu section allows the definition and management of global variables for flexible system configuration. - Queue: The
Queuemenu section provides real-time insight into the processing status of internal system tasks and data handling.
Info
More information can be found in the online Zabbix documentation here
Tip
You will see that Zabbix is using modal forms in the frontend on many places.
The problem is that they are not movable. This
module created by one of the Zabbix developers UI Twix will solve this problem
for you.
Warning
At time of writing there is no Dashboard import/export functionality in zabbix. So when upgrading dashboards it needs to be created by hand. It was on the roadmap for 7 but didn't made it so feel free to vote https://support.zabbix.com/browse/ZBXNEXT-5419
Заключение
The Zabbix frontend serves as the central command center for monitoring, configuration, and system awareness. In this chapter, you explored how to navigate its interface from dashboards and the customizable main menu to powerful tools like system information and global search. You learned how each menu section (Monitoring, Data Collection, Alerts, Users, Administration, and more) aligns with distinct functions, and how kiosk mode and layout controls help optimize visibility during daily operations.
Additionally, the system information widget stands out as a real time diagnostic snapshot, revealing critical metrics such as server status, number of hosts, templates, items, triggers, and user activity all of which aid rapid troubleshooting and performance assessment.
By mastering these frontend components, you're now better equipped to confidently navigate Zabbix, manage user access, interpret monitoring data, and maintain your environment more effectively. This foundational knowledge lays the groundwork for deeper exploration into host configuration, authentication mechanisms, and advanced monitoring workflows in the chapters that follow.
Вопросы
-
Which frontend section (Monitoring, Data Collection, Alerts, Users, or Administration) do you think you'll use most often in your daily work, and why?
-
How can kiosk mode be useful in a real-world monitoring environment, and what types of dashboards would you display with it?
-
What insights can the system information widget provide during troubleshooting, and how might it help identify issues with server performance?
-
Why is it important to understand the difference between data displayed in “Monitoring” and configuration options found in “Data Collection”?
-
If you were onboarding a new team member, which parts of the frontend would you show them first, and why?
Полезные URL-адреса
- https://www.zabbix.com/documentation/current/en/manual/web_interface/frontend_sections/dashboards
- https://blog.zabbix.com/handy-tips-6-organize-your-dashboards-and-create-slideshows-with-dashboard-pages/17511/
- https://blog.zabbix.com/interactive-dashboard-creation-for-large-organizations-and-msps/30132/